
NL reports that MLS® home sales soften to lowest August level since 2020; overall inventory remains significantly below historical norms
Province-Wide Statistics
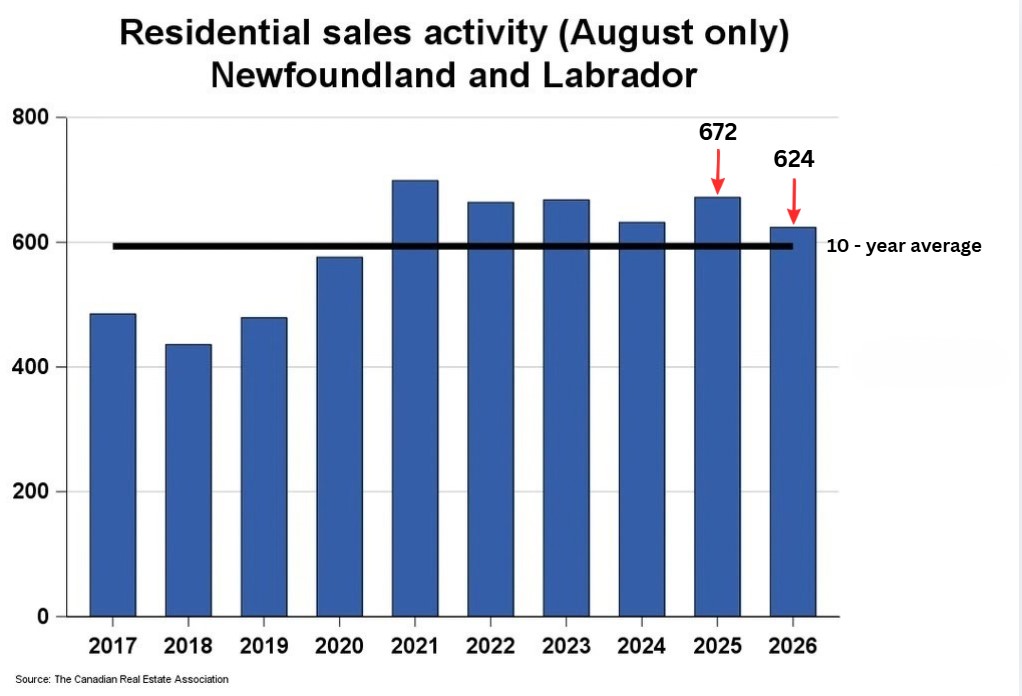

There were 624 units sold through the MLS® System of the Newfoundland and Labrador Association of REALTORS® in August 2026. This is a decrease of 7.1% from August 2025.
On a year-to-date basis, home sales totaled 3,517 units over the first eight months of the year. This was a decline of 6.7% from the same period in 2025.
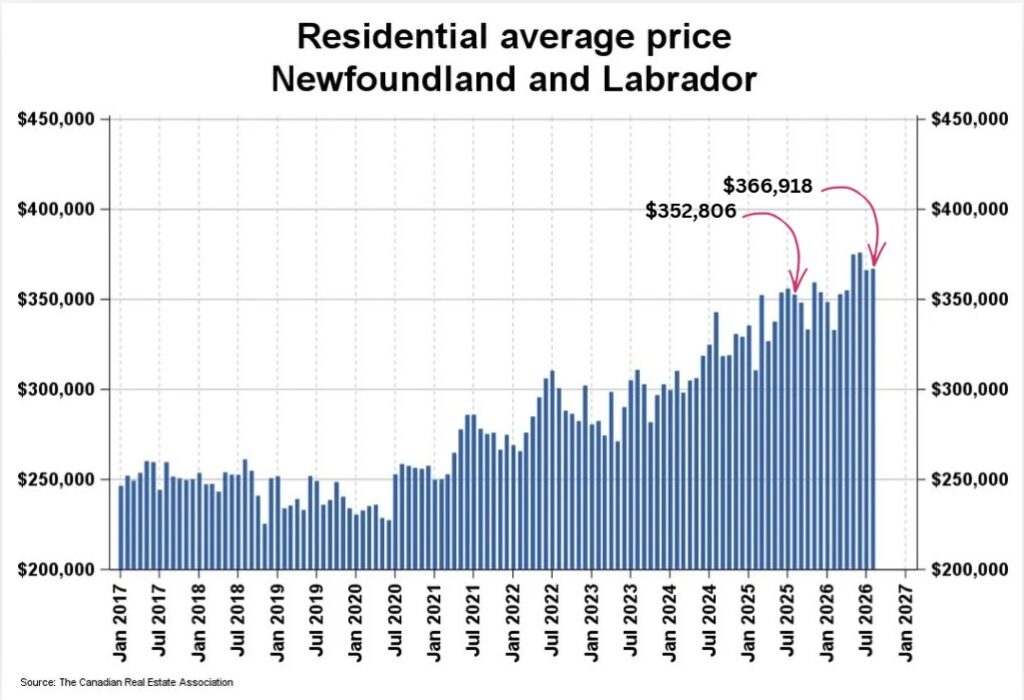
The average price of homes sold in August 2026 was $366,918, up by 4% from August 2025.
The more comprehensive year-to-date average price was $362,360, an increase of 5.6% from the first eight months of 2025.
The MLS® Home Price Index (HPI) tracks price trends far more accurately than is possible using average or median price measures. (Refer to the brief explanation of the HPI at the end of the post)
The overall MLS® HPI composite benchmark price was $358,400 in August 2026, increasing by 6.8% compared to August 2025.
The benchmark price for single-family homes was $361,500, a gain of 6.7% on a year-over-year basis in August. By comparison, the benchmark price for townhouse/row units was $334,500, up by 11.9% compared to a year earlier, while the benchmark apartment price (condos) was $269,200, an increase of 6.7% from year-ago levels.
The dollar value of all home sales in August 2026 was $229 million, was a small reduction of 3.4% from the same month in 2025.
Statistics – St. John’s Only

Residential activity in St. John’s posted a substantial decline of 10.8% on a year-over-year basis in August, while activity in the rest of the province posted a decline of 5.7%.
Single detached home sales in St. John’s were down sharply by 21.3% from levels recorded in August 2025.
The overall MLS® HPI composite benchmark price for homes in St. John’s was $425,400 in August 2026, increasing by 7.5% compared to August 2025.
The benchmark price for single-family homes in St. John’s was $445,700, a gain of 7.6% on a year-over-year basis in August. By comparison, the benchmark price for townhouse/row units was $330,000, up by 13.2% compared to a year earlier, while the benchmark apartment (condos) price was $268,600, an increase of 6.8% from year-ago levels
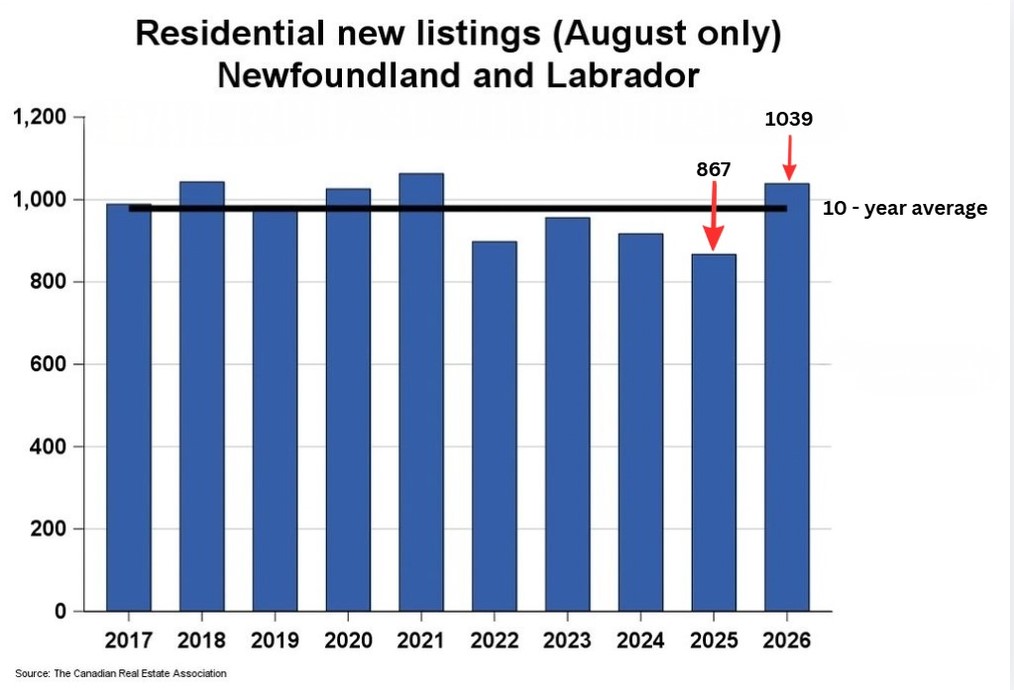
The number of new listings rose 19.8% from August 2025. There were 1,039 new residential listings in August 2026. This was the largest number of new listings added in the month of August in five years.
New listings were 11.1% above the five-year average and 6.2% above the 10-year average for the month of August.
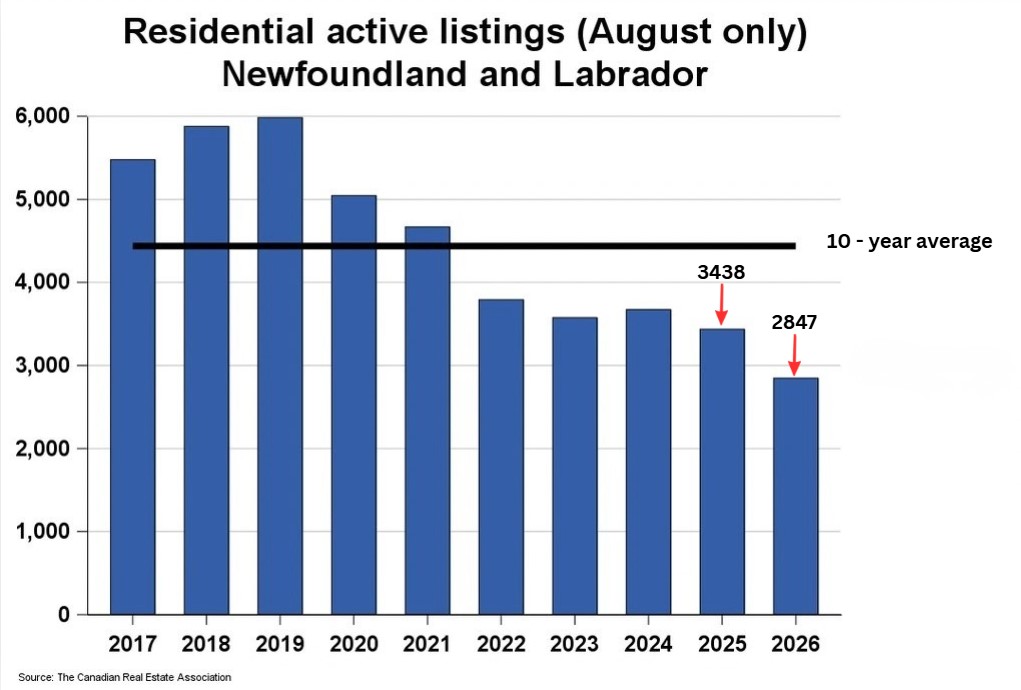
There were 2,847 active residential units listed on the market at the end of August, a sharp decrease of 17.2% from the end of August 2025. Active listings haven’t been this low in the month of August in more than two decades.
Active listings were 17.8% below the five-year average and 35.9% below the 10-year average for the month of August.
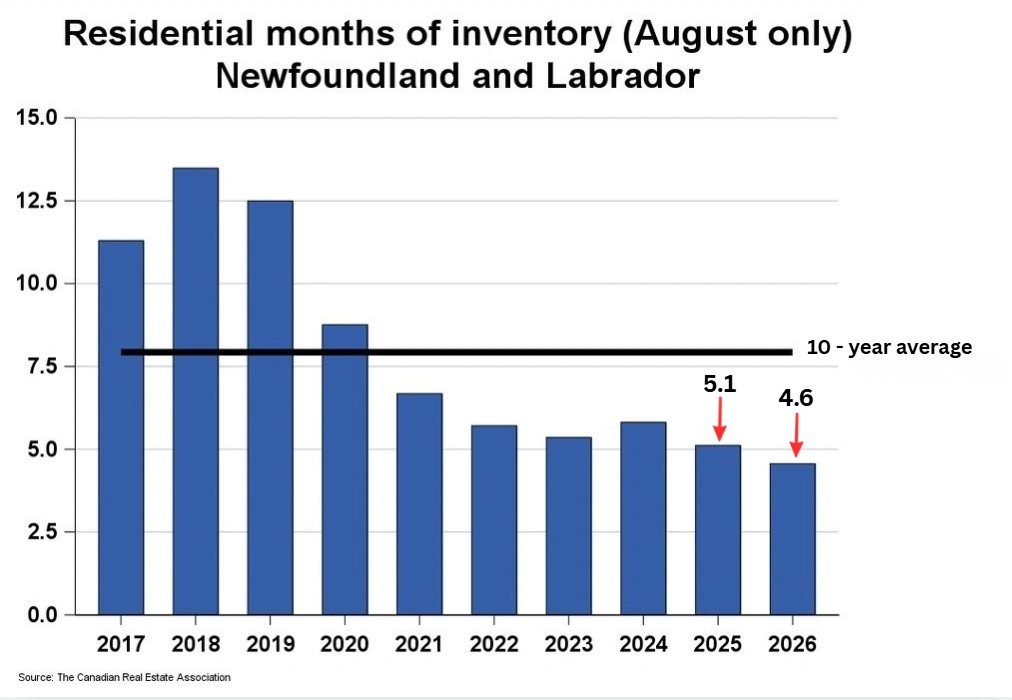
There were 4.6 months of inventory at the end of August 2026, down from the 5.1 months at the end of August 2025 and below the long-run average of 7.9 months for this time of year.
The number of months of inventory is the number of months that it would take to sell current inventories at the current rate of sales activity.
Summary Table
| Month | Sales | Average Price | New Listings | Number of Active Listings | Months of Inventory at Month End* |
|---|---|---|---|---|---|
| January | 288 | $348,366 | 524 | 1688 | 5.8 |
| February | 272 | $332,983 | 449 | 1665 | 6.1 |
| March | 357 | $352,854 | 617 | 1724 | 4.8 |
| April | 357 | $355,067 | 778 | 1934 | 5.4 |
| May | 410 | $374,876 | 1108 | 2399 | 5.9 |
| June | 554 | $375,334 | 1017 | 2567 | 4.6 |
| July | 658 | $366,413 | 1201 | 2815 | 4.3 |
| August | 624 | $366,918 | 1039 | 2847 | 4.6 |
*Months of Inventory at the end of each month is calculated by dividing the number of active listings at the end of each month by the number of sales during the month.
This information on the August NL Residential Real Estate Market has been brought to you by:
Gar Mouland,
Canadian Commercial Network of Realtors® (CCN)
Broker/Owner/Operator
Outlier NL Realty
(709) 728-2212
https://www.outliernlrealty.com/
Where great service and great savings happily coexist!
Reach out to me at any time for an absolutely free consultation/chat on any aspect of the residential and/or the commercial real estate market.
It Pays to be Informed!
Understanding the MLS® Home Price Index (HPI)*
*The MLS® Home Price Index (HPI) is one of the most reliable tools for tracking changes in home prices over time. Unlike average or median sale prices, which can fluctuate sharply from month to month, the HPI provides a clearer picture of true market trends.
It tracks price changes for major housing types, including single-family homes, townhouses, and apartments. Prices are measured relative to a base period, making it easy to see how values have risen or fallen over time.
Average and median prices can be misleading because they are heavily influenced by the types of homes sold in a given month.
For example, a rise in luxury home sales can push the average price higher even if typical home values remain unchanged. The MLS® HPI avoids this issue by comparing similar homes over time — an approach often described as an “apples-to-apples” comparison.
Rather than focusing solely on sale prices, the HPI measures how buyers value individual home features.
These include features such as the number of rooms and bathrooms, square footage, lot size, age of the property, and construction details like flooring, roofing, and foundation type. Because these characteristics change gradually, the index produces more stable and meaningful results.